

Long has the question been asked “Which Microsoft tool do I use for dashboards?”. SSRS, Excel, PowerView, Report Builder and PerformancePoint are all candidates. But that has all changed, and the future of dashboarding is here: Power BI Designer.
The Power BI Designer is a new companion application for Power BI. It is a standalone Windows Desktop application that can downloaded from the Power BI site or here.
Note that Power BI Designer is an on-prem version, with a companion tool called Power BI Dashboard that is a web version and is available via a “Introducing Power BI Dashboards (Preview) – Try it now” link on the front of your Power BI site. Power BI Dashboard can use files created with Power BI Designer. Think of Power BI Designer as a tool to create the reports, and Power BI Dashboard as the tool to create the dashboard that contains those reports. However, Power BI Dashboard can create a limited number of reports on its own against other products (GitHub, Marketo, Microsoft Dynamics CRM, Salesforce, SendGrid, Zendesk), as well as against on-prem SSAS (see Using Power BI to access on-premise data), and finally it can connect to an Excel workbook (where data can be automatically refreshed from OneDrive).
Power BI Designer combines Power Query, Power View (a slimed-down version) and the Power Pivot Data Model into a seamless experience that will allow you to build your reports in an offline fashion and then upload them to your Power BI Site via Power BI Dashboard. When you finish building your report you save it in a new Power BI designer file format called PBIX.
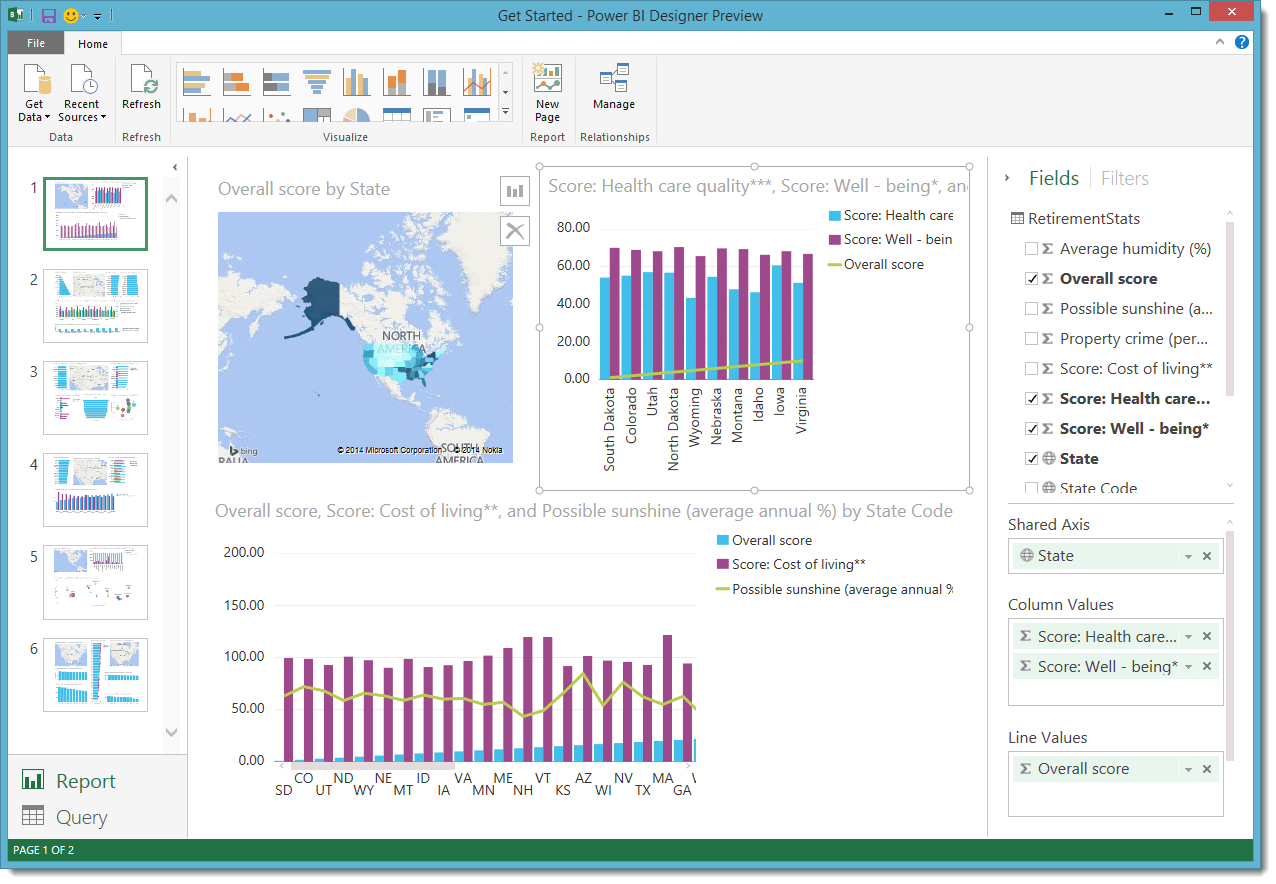
Note that Power BI Designer reports can’t be refreshed after uploaded– must be refreshed manually in Power BI Designer an uploaded again (for now). But you can edit the design of the report after it has been uploaded.
The Power BI add-ins (Power Query, Power Pivot, Power View, Power Map) for Excel 2013 are still available and you can continue to use that to model your data and build reports. The Power BI Designer will be another option and also can allow customers with an older version of Office to be able to create reports.
Within the Power BI Designer is a true SSAS tabular data model. A SSAS tabular instance runs as a child process in local mode.
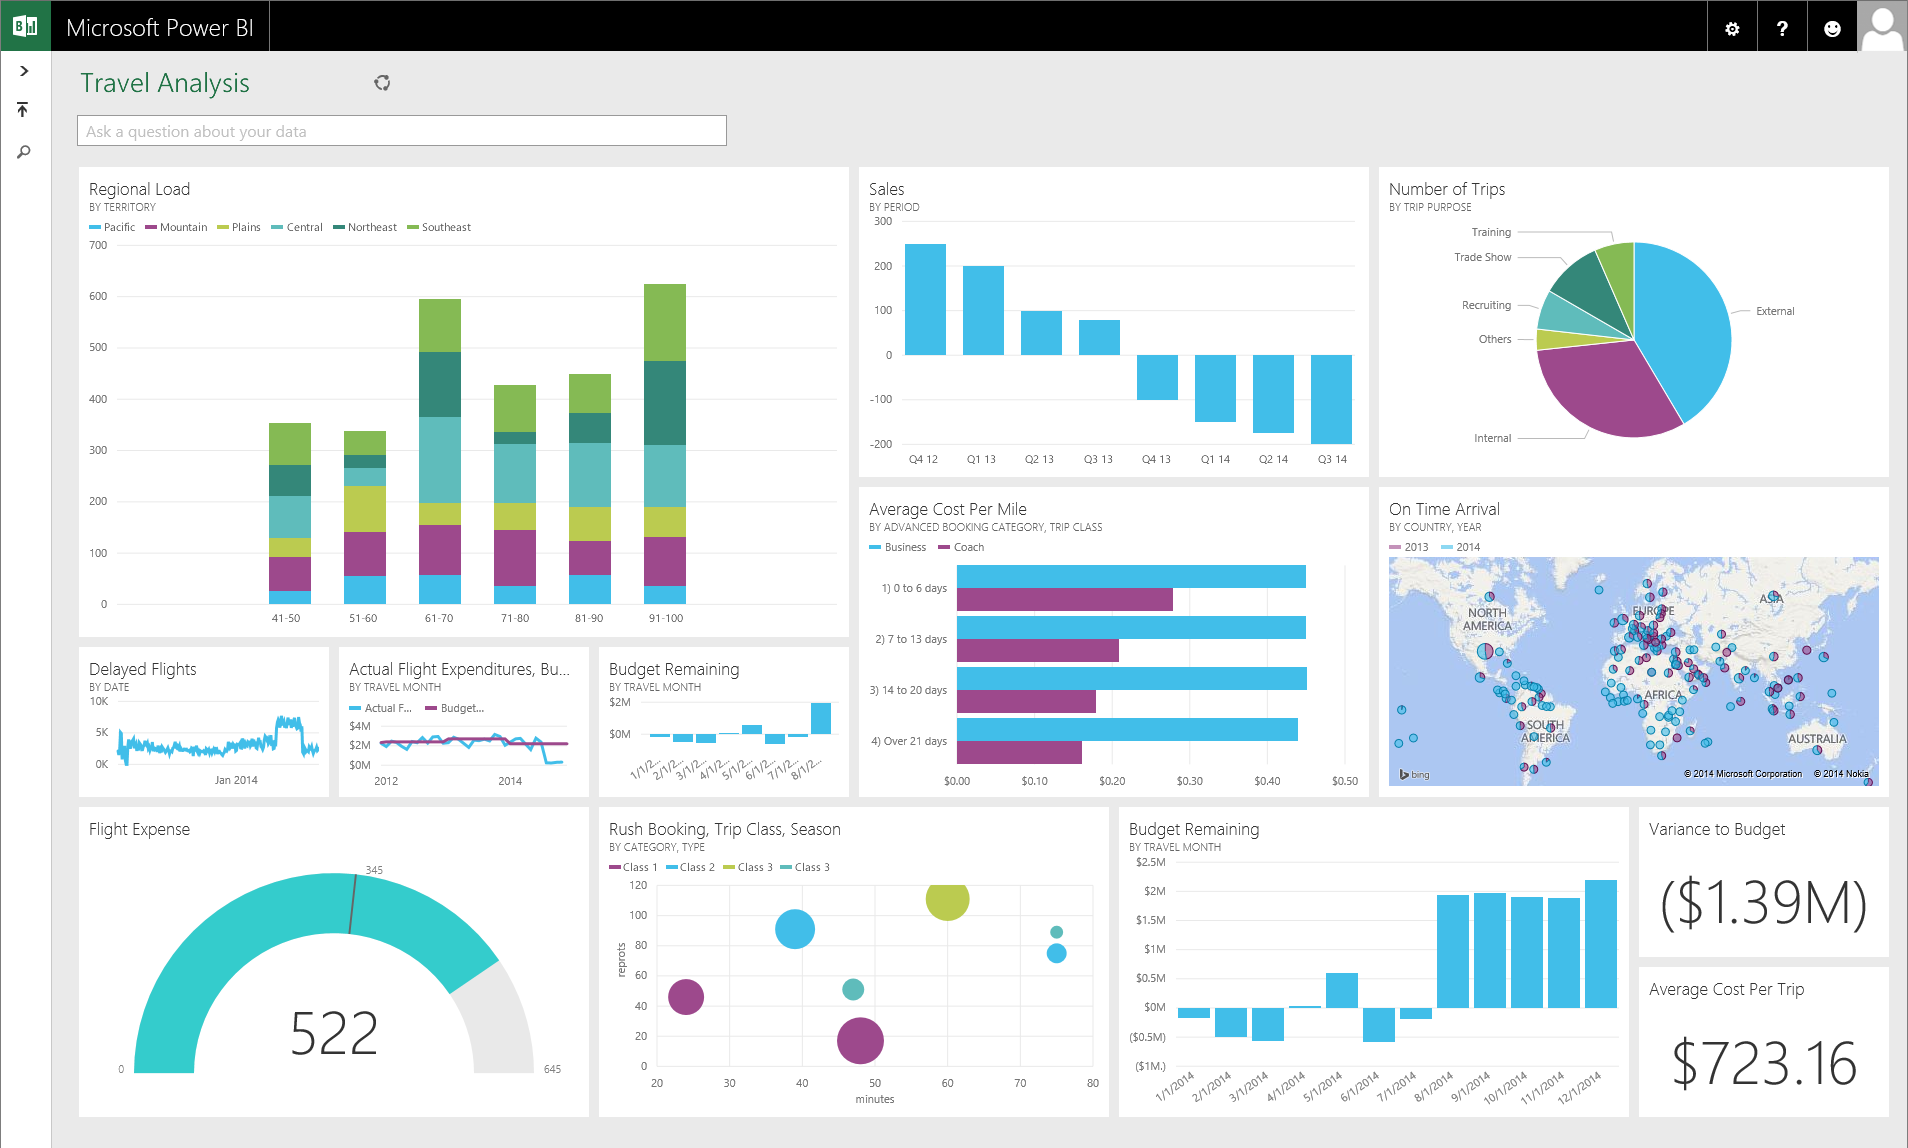
Users can create personalized dashboards to monitor their most important data. A dashboard combines on-premises and cloud-born data in a single pane of glass, providing a consolidated view across the organization regardless of where the data lives.
Users can easily explore all their data using intuitive, natural language capabilities and receive answers in the form of charts and graphs. They can also explore data through detailed reports that target specific aspects of their business. Visuals from these reports can also be pinned to their dashboards for continuous monitoring. As part of this experience new visualizations have been added including combo charts, filled maps, gauges, tree maps, and funnel charts.
Power BI Dashboard provides “out of the box” connectivity to a number of popular SaaS applications. In addition to the existing connection with Microsoft Dynamics CRM Online, customers can also connect to their data in Salesforce, Zendesk, Marketo, SendGrid, and GitHub with many more to come in the months ahead. With an existing subscription to one of these services, customers can login from Power BI. In addition to establishing a data connection, Power BI provides pre-built dashboards and reports for each of these applications.
Also is a new Power BI connector for SQL Server Analysis Services that allows customers to realize the benefits of a cloud-based BI solution without having to move their data to the cloud. Customers can now create a secure connection to an “on-premises” SQL Server Analysis Services server from Power BI in the cloud. When users view and explore dashboards and reports, Power BI will query the on-premise model using the user’s credentials.
There is still a way to go before Power BI Designer is the solution for any and all dashboards you want to create. It will need to add all the features that are in PerformancePoint, such as KPI’s. And hopefully there will be a version that will allow dashboards to be deployed to on-prem SharePoint. But this is a great start and I’m excited to see what is next!
More info:
Videos Power BI Designer
New Power BI features available for preview
Getting Started with Power BI Designer
Video Power BI Designer Preview
Unwrapping the Power BI vNext Public Preview
Getting Started with the Power BI Dashboards Public Preview

![]()