

Introduction
In Financial Data, analyzing the Moving Average (MA) is a very common practice. The direction of the moving average conveys important information about prices, whether that average is simple or exponential. A rising moving average shows that prices are generally increasing. A falling moving average indicates that prices, on average, are falling.
This article will describe how to calculate the Simple Moving Average of a stock price using T-SQL.
Solution
Although there are multiple ways to calculate the Moving Average in SQL, we will use the WINDOW function method in T-SQL to calculate a fixed number of rows ahead and a fixed number of rows behind the current row.
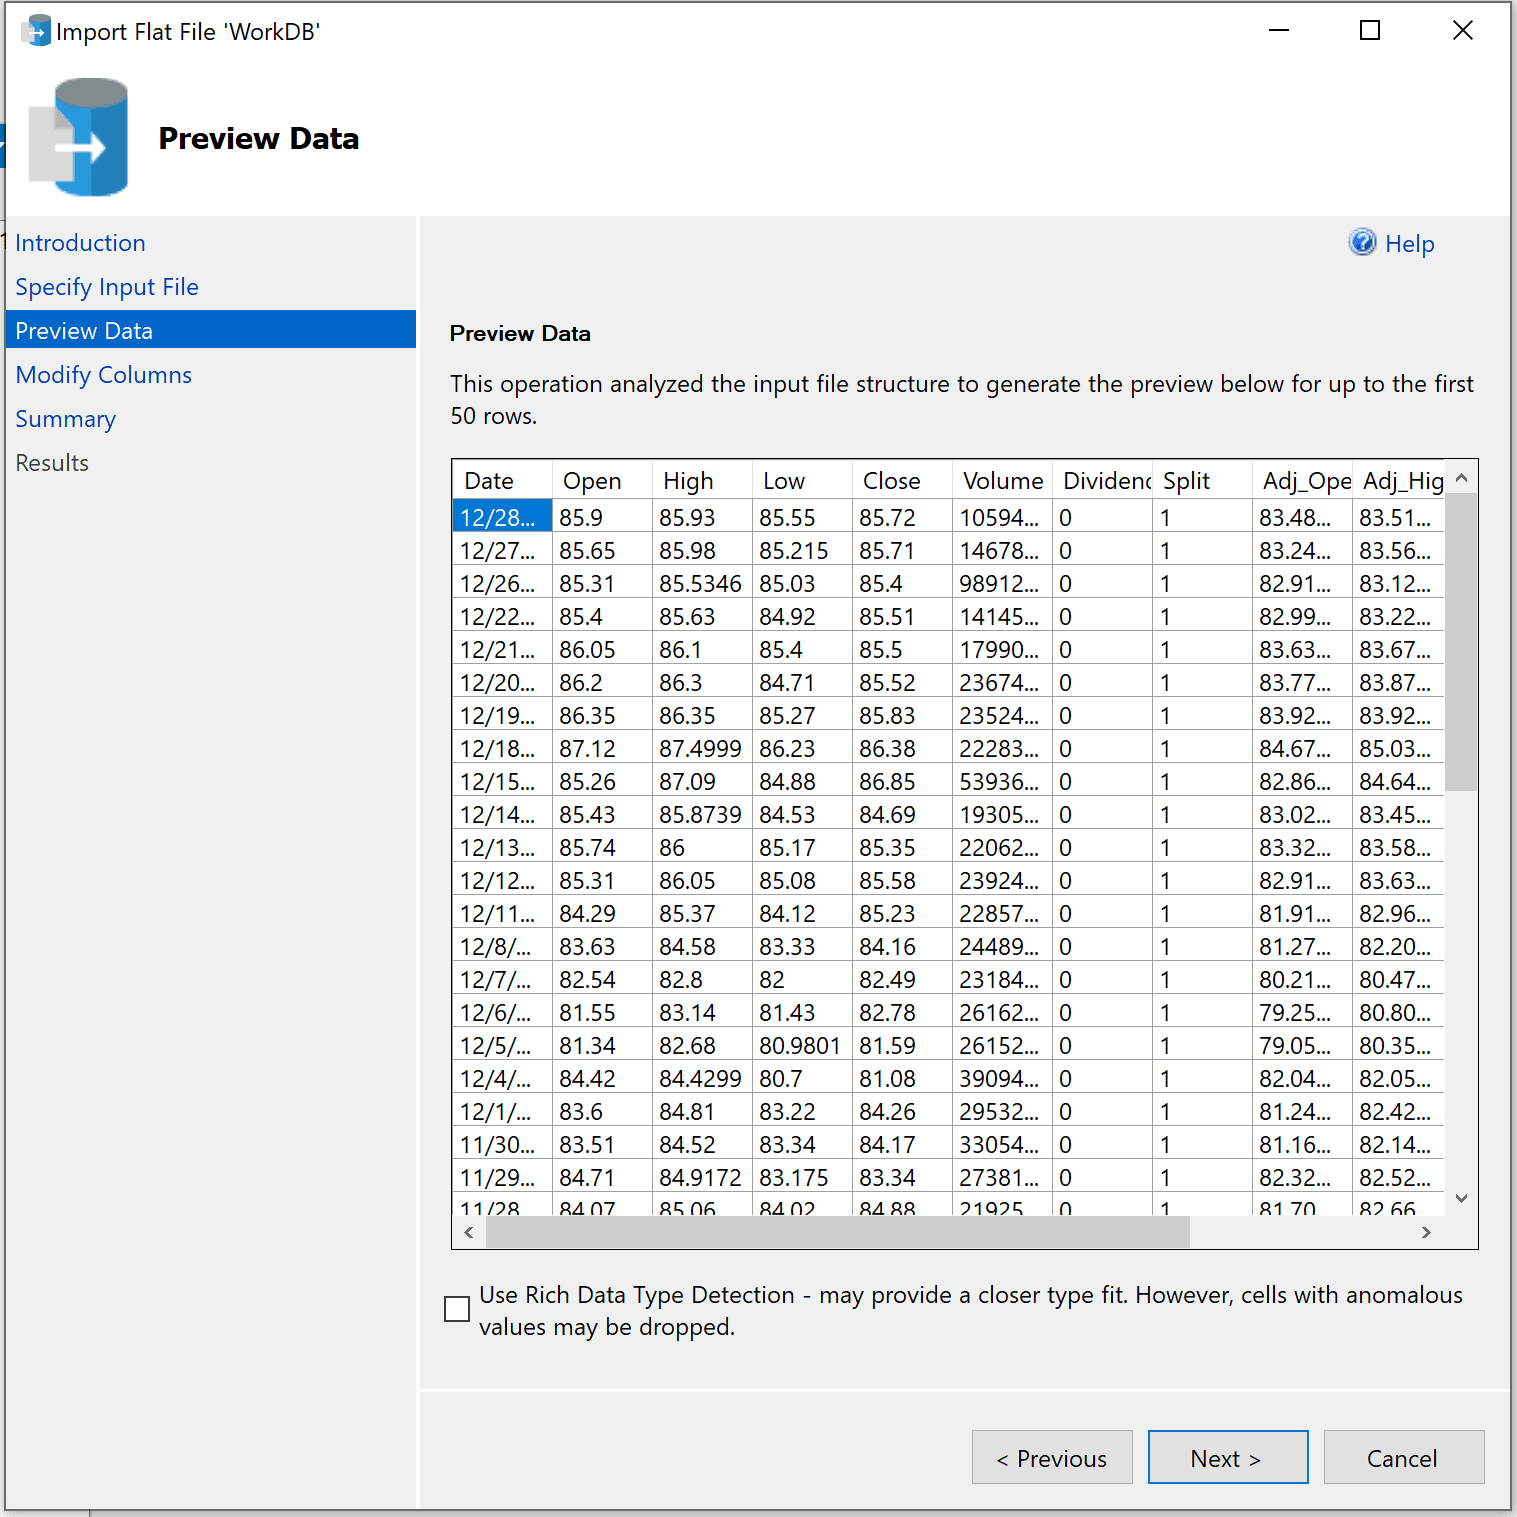
First, let us prepare our data as we will need it to make the calculations. For the purpose of this tutorial, I'm going to use the stock price for Microsoft, which can be freely downloaded from Quandl in CSV format. We need to import this data into SQL Server, which I've done using the "Import Flat File Wizard".
Once the data is imported into SQL Server, let's query the table and verify that the data has been imported as expected.
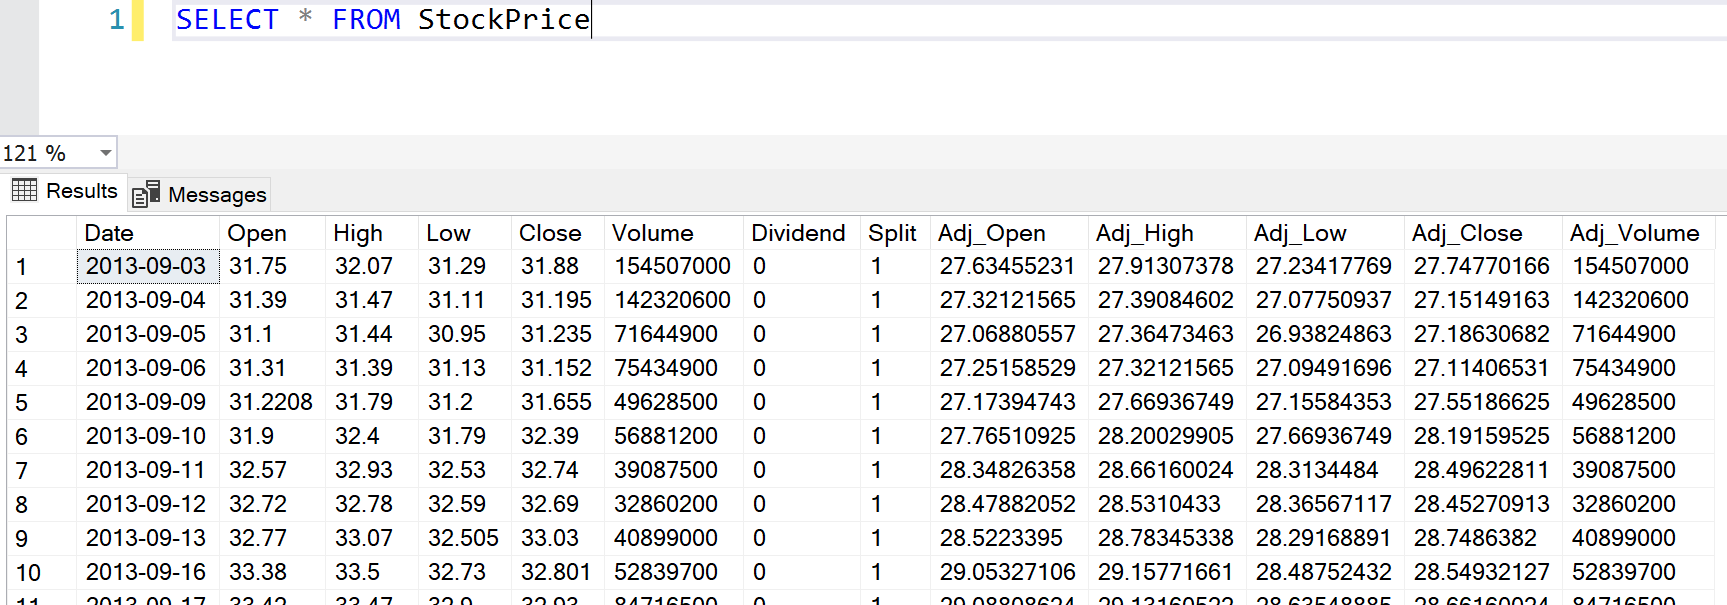
The table shows the OHLC data for Microsoft for all days starting 2013-09-03. For our analysis, we will consider the Closed price and calculate the MA on the Closed price only.
Now that our data is ready, let's calculate an MA of 15 days. This will include 7 previous days, the current day, and 7 days ahead into consideration while calculating the MA. We will implement this using a window function, in this case an aggregate function. It becomes a window function by adding the OVER clause. Basically, the OVER clause creates a set of records for every record in the selected dataset. This is often used to calculate rank or aggregate values specific to that window. To learn more about the OVER clause in SQL please follow Wayne's article where the author explains more on how the query is designed to work.
The T-SQL script is attached below.
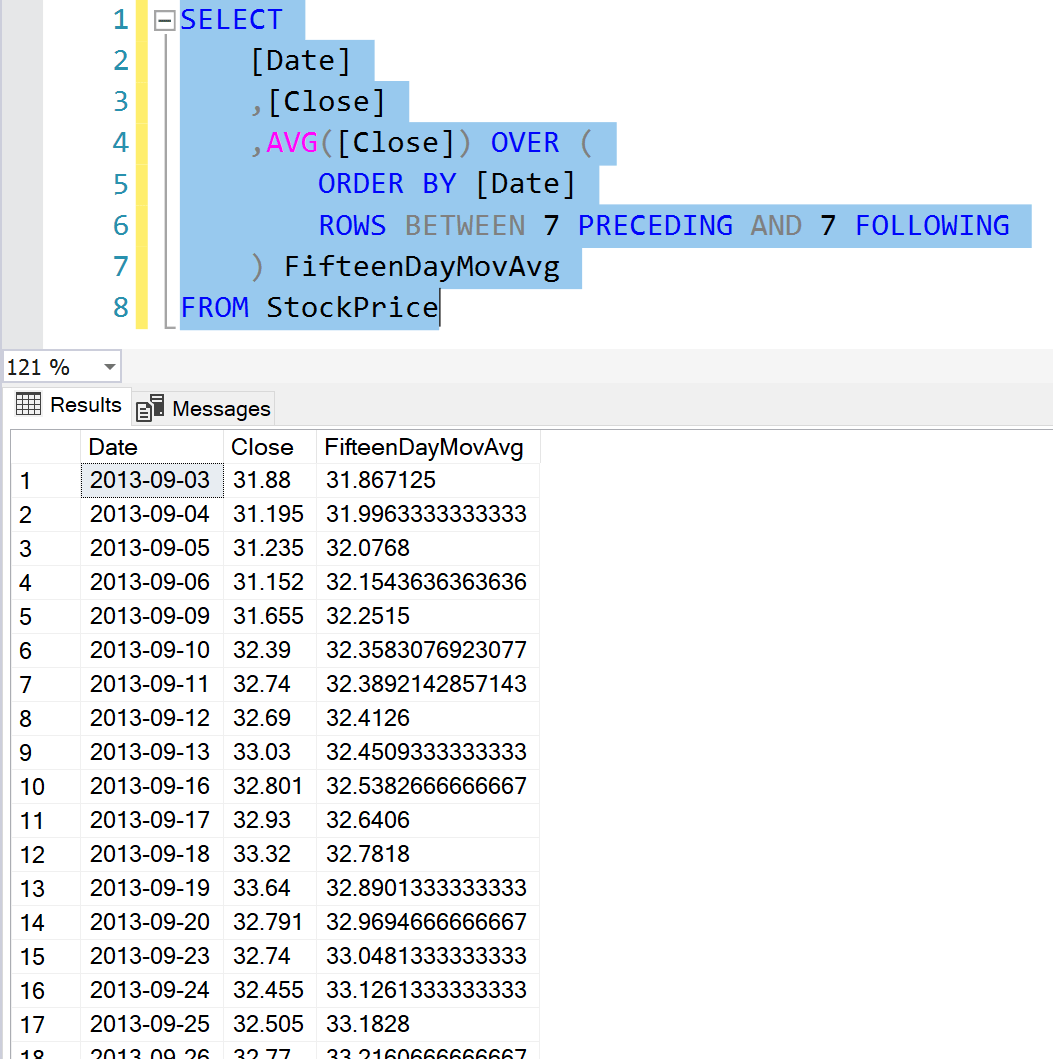
SELECT
	[Date]
	,[Close]
	,AVG([Close]) OVER (
		ORDER BY [Date]
		ROWS BETWEEN 7 PRECEDING AND 7 FOLLOWING
	) FifteenDayMovAvg
FROM StockPrice
The result of the above query is below.
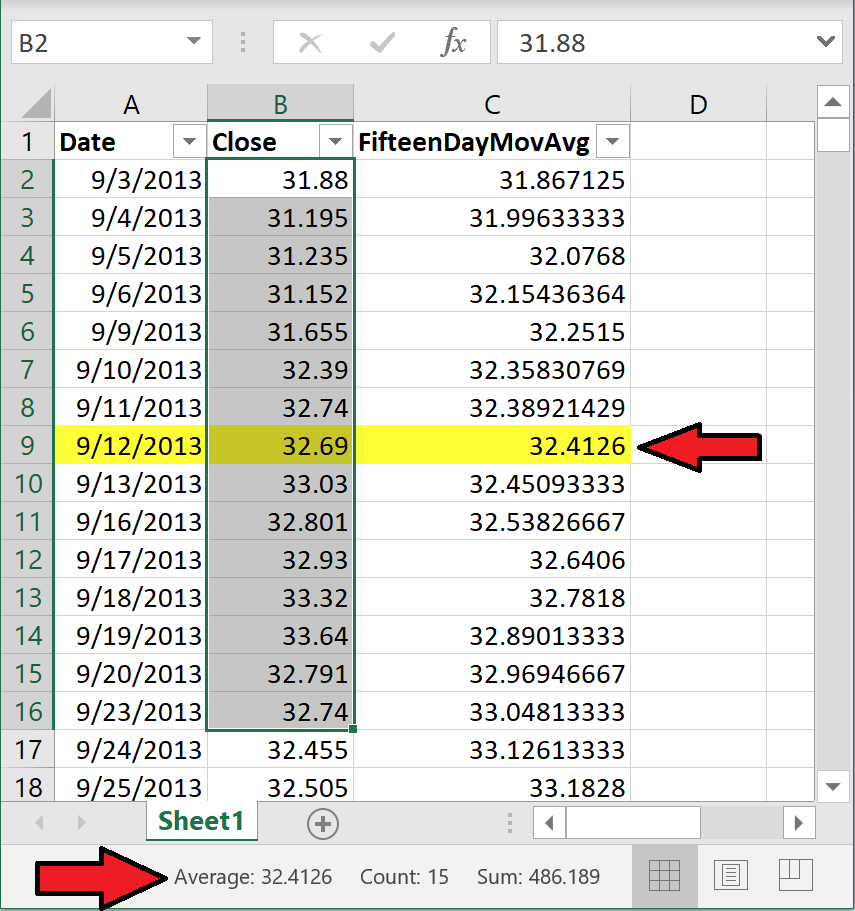
Once we have the result in SQL, we can easily copy and paste the data into Excel and verify the calculations. As you can see, the MA for 2013-09-12 is "32.4126", which is also the same when we calculate the average in excel from 2013-09-03 (Last 7 Days) through 2019-09-23 (Next 7 Days). In this example, I'm calculating the average by just selecting the "Close" values for 7 previous rows and 7 rows after that of 2019-09-12. The average in Excel can be found in the status bar below (Fig-4).
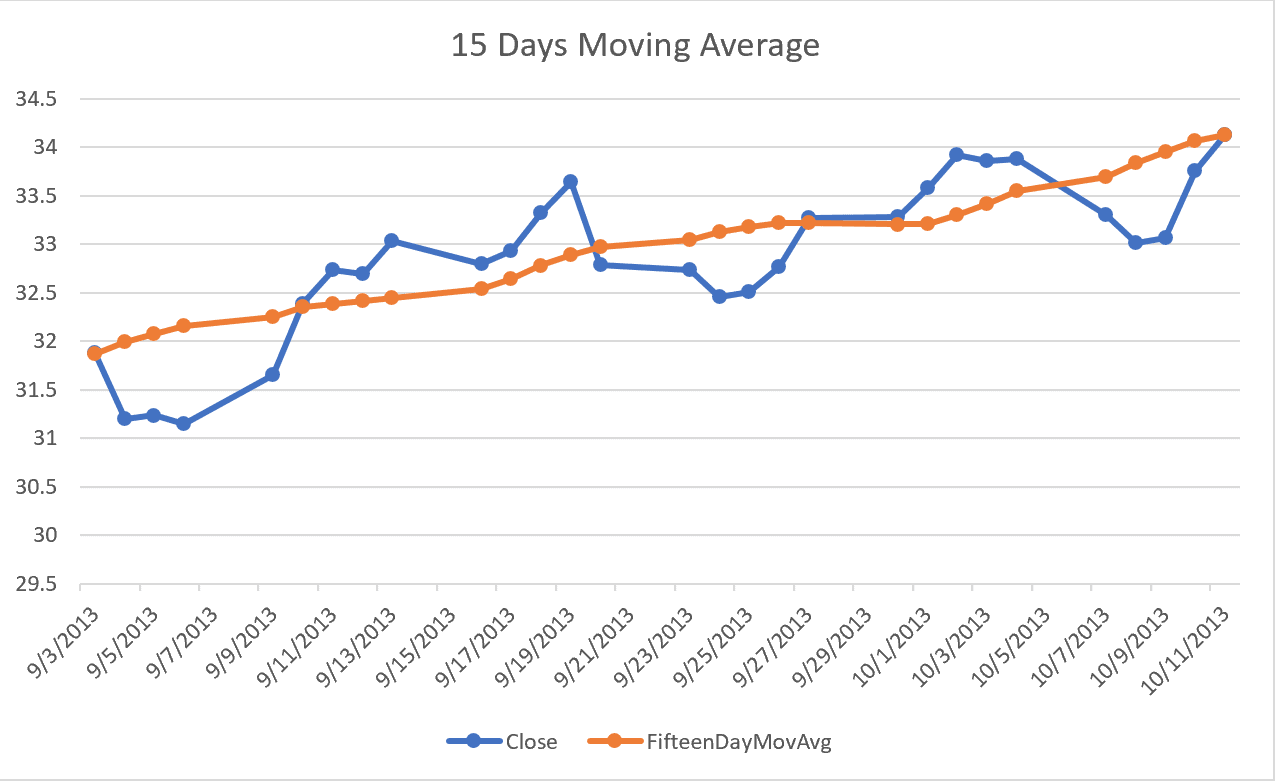
If we plot the above data on a line chart, we can see that the data points have been smoothed out and now we have a clear tread visible which is helpful in analyzing this data further on.
References
- Learn more about calculating Moving Averages from Investopedia.
- Read more about Windows Functions in SQL.